7.4. Costs and KPIs
What are costs and KPIs in MLOps?
Costs in the context of Machine Learning Operations (MLOps) refer to the financial expenditures associated with developing, deploying, and maintaining machine learning models. These costs encompass various factors including:
- Infrastructure: This covers the costs of using cloud computing resources (e.g., virtual machines, storage, databases), on-premise servers, and specialized hardware like GPUs, essential for training and deploying models.
- Data: Obtaining, cleaning, labeling, and storing data can incur significant costs. The size, complexity, and source of the data influence these costs.
- Personnel: Hiring and managing data scientists, machine learning engineers, data engineers, DevOps professionals, and other personnel involved in the MLOps lifecycle constitutes a significant portion of costs.
- Software and Tools: Licensing fees for machine learning libraries, frameworks, data processing tools, monitoring platforms, and other software tools contribute to overall costs.
- Operational Expenses: Day-to-day running costs, such as electricity, network bandwidth, security measures, and maintenance for hardware and software, fall under operational expenses.
Key Performance Indicators (KPIs) are metrics used to assess the success and effectiveness of MLOps projects. These KPIs vary based on the project's goals but generally include:
- Model Accuracy: Metrics like precision, recall, F1-score, and AUC measure how well the model predicts outcomes.
- Model Performance: This covers metrics related to the model's speed, such as inference latency and throughput, crucial for real-time applications.
- Data Quality: Metrics like data completeness, accuracy, and timeliness assess the reliability of the data used to train and evaluate models.
- Deployment Efficiency: This measures how smoothly and rapidly models are deployed, including metrics like deployment time and frequency.
- Operational Stability: Uptime, error rates, and resource utilization track the stability and reliability of deployed models.
- Business Impact: These metrics directly measure the model's impact on the business, such as increased revenue, reduced costs, improved customer satisfaction, or enhanced decision-making.
By monitoring and optimizing both costs and KPIs, organizations can ensure that their MLOps projects are not only technically successful but also financially viable and deliver tangible business value.
Why should you track costs and KPIs?
Tracking costs and KPIs is essential for several reasons:
- Optimize Resource Allocation: By understanding where costs are incurred, organizations can identify areas for improvement and make informed decisions about resource allocation, maximizing Return on Investment (ROI).
- Measure Progress and Success: Tracking KPIs helps teams evaluate the progress and effectiveness of their efforts, ensuring they stay aligned with business objectives.
- Identify Bottlenecks: Tracking performance metrics can help pinpoint bottlenecks in the MLOps pipeline, such as slow data processing, inefficient model training, or deployment delays, enabling targeted improvements.
- Support Data-Driven Decision-Making: Accurate data on costs and performance metrics empowers teams to make data-driven decisions, driving continuous improvement and innovation.
How can you perform a back-of-the-envelope calculation?
Back-of-the-envelope calculations are a quick and simple way to estimate costs and KPIs, providing a preliminary understanding of the financial and performance aspects of an MLOps project. These estimates, while not precise, offer valuable insights for early planning and resource allocation decisions.
For example, to estimate the cost of using a cloud computing instance for model training:
- Identify Resource Requirements: Determine the type of instance needed (e.g., CPU-based, GPU-based), the number of instances, and the duration of training time.
- Obtain Pricing Information: Consult the cloud provider's pricing information to determine the hourly rate for the chosen instance type.
- Estimate Total Cost: Multiply the hourly rate by the estimated training time and the number of instances to get an approximate cost.
Similarly, you can estimate KPIs based on available data and historical information. For instance, if you have past data on model accuracy and deployment frequency, you can use these values to estimate the expected performance and deployment efficiency of a new model.
Back-of-the-envelope calculations can be refined as you gain more information about the project's specifics. Remember, these estimates are primarily for initial planning and should be revisited and updated as the project progresses.
How can you find good KPI metrics for your MLOps project?
Identifying appropriate KPIs for your MLOps project involves aligning them with your business goals:
- Start with Business Objectives: Define clear business objectives that the MLOps project aims to achieve. For instance, if the goal is to improve customer satisfaction through personalized product recommendations, the relevant KPI might be click-through rate or conversion rate.
- Consider the MLOps Lifecycle: Identify key stages in the MLOps lifecycle, such as data preparation, model training, deployment, and monitoring, and choose KPIs that reflect the performance and efficiency of these stages.
- Balance Between Technical and Business Metrics: Include both technical metrics (e.g., model accuracy, latency) and business metrics (e.g., revenue impact, customer churn reduction) to gain a holistic view of the project's success.
- Prioritize Actionable Metrics: Focus on KPIs that are actionable, meaning they can be used to make improvements or drive decision-making.
- Regularly Review and Update KPIs: As the project evolves and business priorities change, revisit and update the selected KPIs to ensure they remain relevant and valuable.
Here's an example of aligning KPIs with business goals:
| Business Goal | MLOps KPI | Measurement |
|---|---|---|
| Increase online sales | Click-through rate on product recommendations | Number of clicks on recommendations divided by the number of times recommendations were shown |
| Reduce customer churn | Customer churn rate after implementing a churn prediction model | Number of customers who churned divided by the total number of customers |
| Improve operational efficiency | Model deployment time | Time taken to deploy a new model version to production |
How can you compute cost and KPI metrics from your MLflow server?
Computing technical costs and KPIs can be streamlined using experiment tracking tools like MLflow. The following notebook from the MLOps Python Package demonstrates how to extract valuable insights from an MLflow server, providing a foundation for understanding project performance and costs.
Notebook Code Breakdown
The provided notebook showcases how to retrieve and analyze data from an MLflow server to compute technical metrics related to experiments, runs, models, and versions:
1. Imports: The notebook begins by importing necessary libraries: mlflow for interacting with the MLflow server, pandas for data manipulation, and plotly.express for visualization.
2. Options and Configs: This section defines display settings for pandas dataframes and sets configuration parameters like MAX_RESULTS to limit the number of items retrieved and TRACKING_URI and REGISTRY_URI to specify the MLflow server location.
3. Clients: It establishes an MlflowClient object to communicate with the MLflow server based on the specified tracking and registry URIs.
4. Indicators: This is the core section where the code retrieves data about experiments, runs, models, and versions from the MLflow server. Each retrieval operation is followed by data processing and transformation steps using pandas:
- Experiments: It fetches experiment information, converts timestamps to datetime objects, and displays the first few rows of the dataframe.
- Runs: Retrieves run data, including start and end times, tags, and other logged information, then prepares the data for analysis and visualization.
- Models: Fetches information about registered models, converts timestamps to datetime objects, and removes the
latest_versionscolumn. - Versions: Gets data for model versions, extracts the first alias (if any), converts timestamps to datetime objects, and displays the first few rows.
5. Dashboards: This section demonstrates the use of plotly.express to create interactive visualizations that offer insights into the collected data:
- Experiment Creation Time: Plots a strip chart showing experiment creation times, categorized by lifecycle stage.
- Model Creation Timestamp: Creates a strip chart displaying the creation timestamps of registered models.
- Version Creation Timestamp: Generates a strip chart illustrating version creation timestamps, grouped by model name.
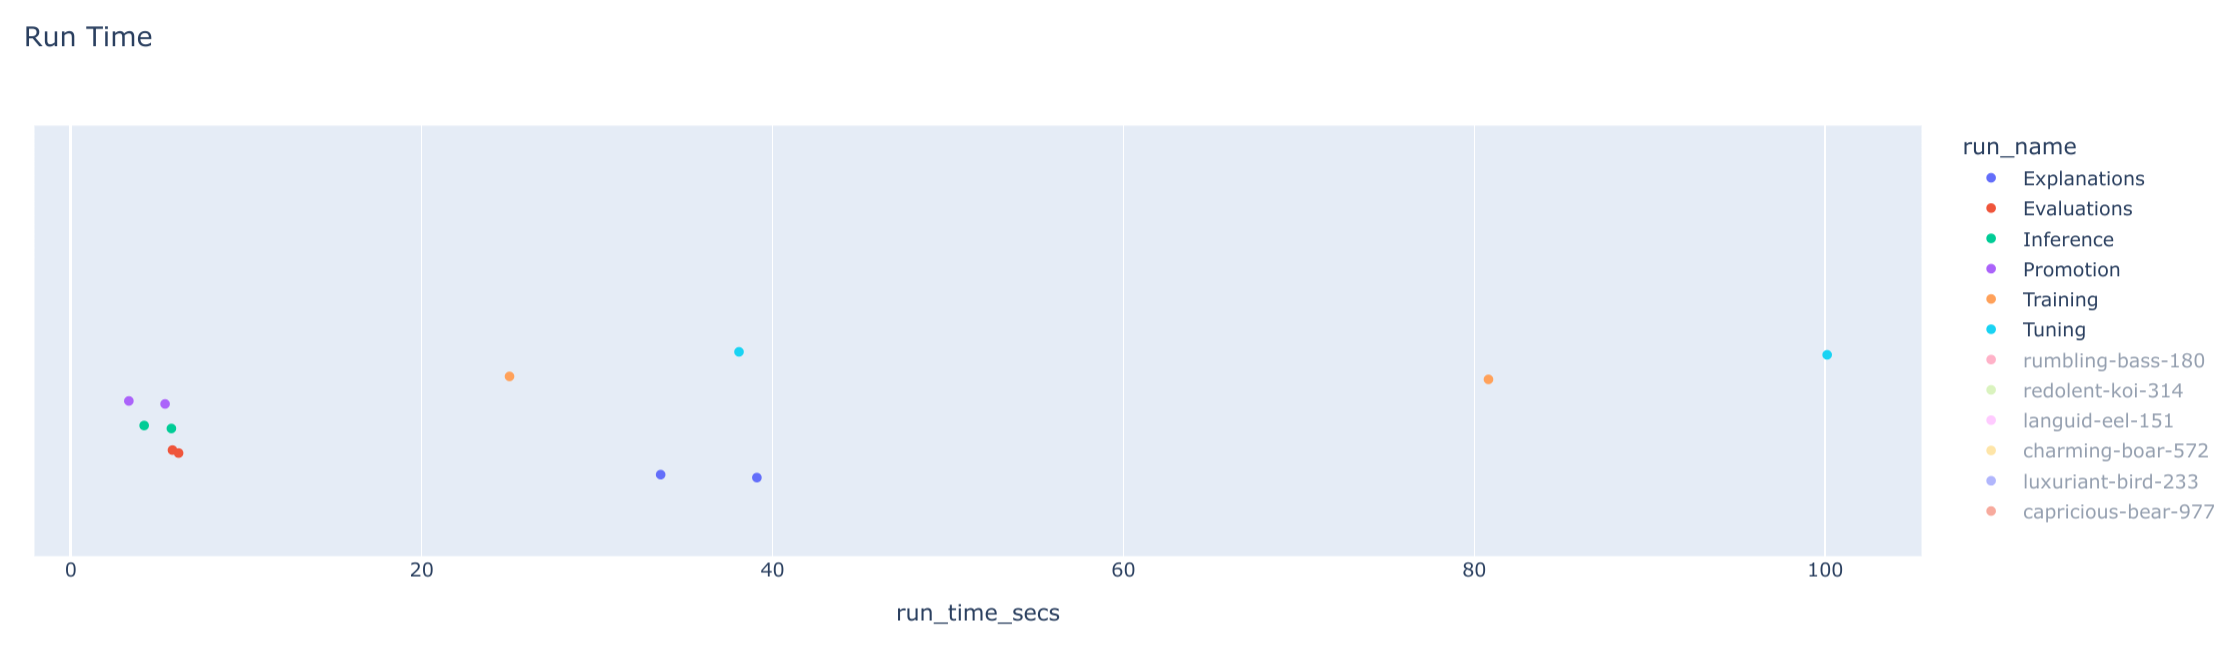
- Run Run Time: Draw a strip chart of the MLflow run time per run name (training, tuning, ...).
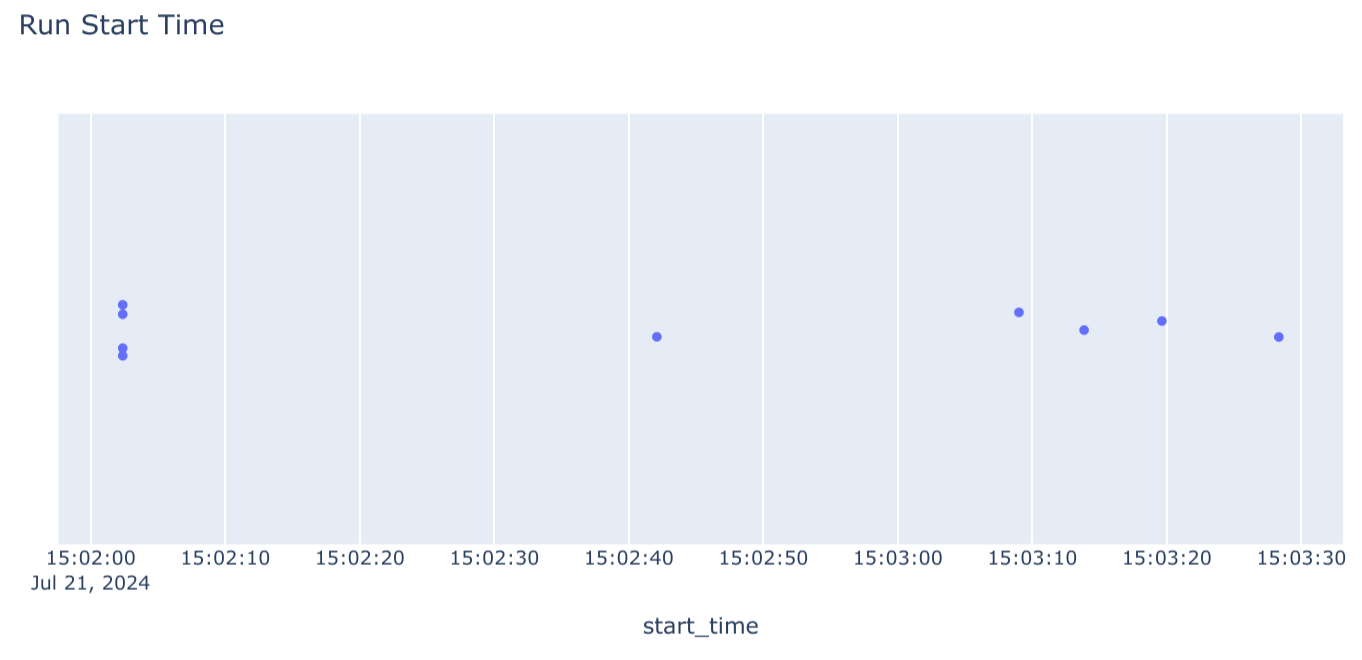
- Run Start Time: Plots a strip chart showcasing run start times, colored by experiment ID.
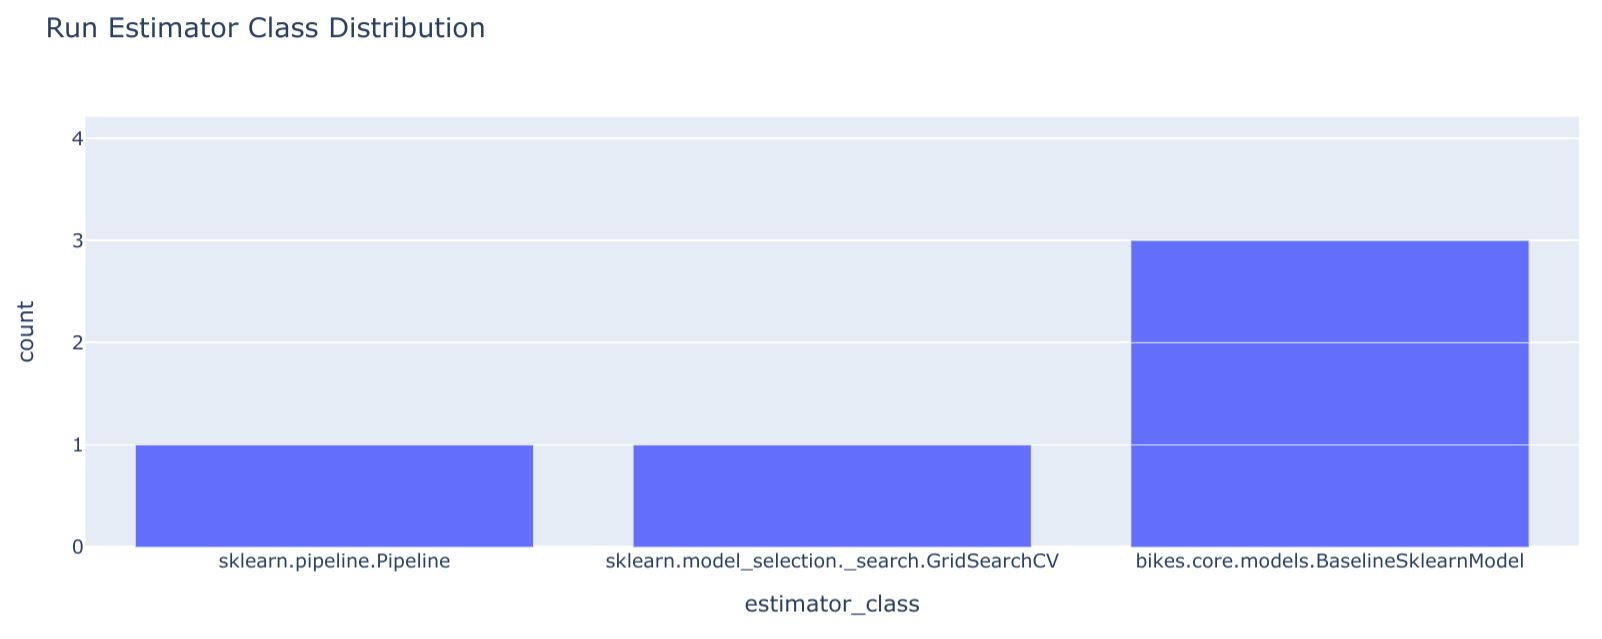
- Run Estimator Class Distribution: Creates a bar chart showing the distribution of estimator classes used in runs.
Interpreting Technical Cost and KPI Metrics
While this notebook focuses on retrieving and visualizing technical information from MLflow, it provides a basis for deriving cost and KPI metrics. Here's how you can interpret and extend the provided data to gain insights into costs and KPIs:
- Compute Usage: By analyzing run start and end times, you can estimate the duration of each run and the total compute time for a project. This information, combined with knowledge of your infrastructure costs, helps in estimating compute costs.
- Data Processing Time: Further logging of data processing steps within runs can reveal how much time is spent on data-related tasks, providing insights for optimization.
- Model Training Efficiency: Track the number of runs and their durations to understand how efficiently models are trained. This can identify bottlenecks and guide improvements in model development workflows.
- Deployment Frequency: Analyze the creation timestamps of model versions to track deployment frequency, a key indicator of agility and responsiveness.
- Model Performance Metrics: Retrieve logged metrics like accuracy, precision, recall, and AUC from runs to assess model performance. Compare these metrics across different runs and models to identify the best performing configurations.
Extending the Notebook for Cost Analysis
To delve deeper into cost analysis, you can:
- Incorporate Infrastructure Costs: Introduce variables representing your infrastructure costs, such as the hourly rate for cloud computing instances or the cost of maintaining on-premise hardware.
- Compute Resource Utilization: Calculate resource utilization by multiplying run durations by the cost of the used resources.
- Aggregate Costs: Sum up the utilization costs across all runs to estimate the total cost of an experiment or project.
- Visualize Cost Distributions: Create visualizations to show the breakdown of costs across different stages of the MLOps lifecycle.
Implementing Business-Specific KPIs
Extending the notebook to track business-specific KPIs involves:
- Define Relevant Metrics: Identify the key business metrics that align with your project's objectives.
- Log These Metrics in MLflow: Use
mlflow.log_metric()to record these metrics during your model training and evaluation runs. - Retrieve and Visualize Business KPIs: Retrieve the logged business KPIs from MLflow and create visualizations to analyze trends and identify improvements.
By incorporating cost and KPI tracking into your MLflow workflows, you gain a comprehensive understanding of your project's performance, enabling informed decision-making and optimized resource allocation for maximum business impact.