2.4. Analysis
What is Exploratory Data Analysis (EDA)?
Exploratory Data Analysis (EDA) is a critical step in the data analysis process which involves investigating and summarizing the main characteristics of a dataset, often with visual methods. The goal of EDA is to obtain a deep understanding of the data’s underlying structures and variables, to detect outliers and anomalies, to uncover patterns, and to test assumptions with the help of statistical summaries and graphical representations.
EDA is a flexible, data-driven approach that allows for a more in-depth understanding of the data before making any assumptions. It serves as a foundation for formulating hypotheses, defining a more targeted analysis, and selecting appropriate models and algorithms for machine learning projects.
How can you use pandas to analyze your data?
Dataframe libraries like Pandas are an essential tool for EDA in Python, offering a wide array of functions to quickly slice, dice, and summarize your data. To begin analyzing your dataset with pandas, you can use the following methods:
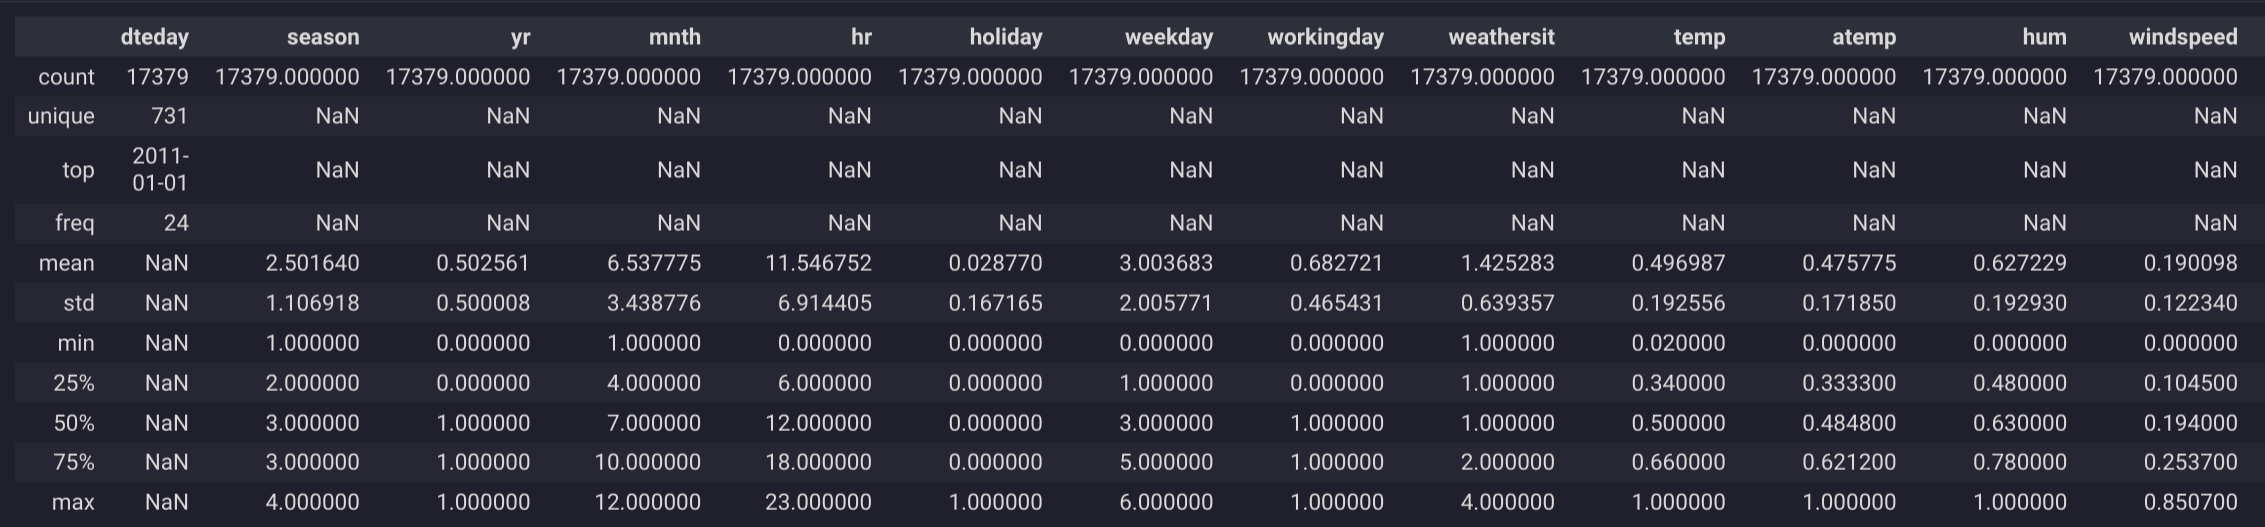
.info(): This method provides a concise summary of a DataFrame, giving you a quick overview of the data types, non-null values, and memory usage. It's a good starting point to understand the structure of your dataset..describe(include='all'): Generates descriptive statistics that summarize the central tendency, dispersion, and shape of the dataset's distributions. By settinginclude='all', you ensure that both numeric and object column types are included in the output, offering a more comprehensive view.
Here’s how you might use these methods in practice:
import pandas as pd
df = pd.read_csv('your_dataset.csv')
# Get a concise summary of the DataFrame
df.info()
# Get descriptive statistics for all columns
df.describe(include='all')
These functions allow you to quickly assess the quality and characteristics of your data, facilitating the identification of areas that may require further investigation or preprocessing.
How can you visualize patterns in your dataset?
Visualizing patterns in your dataset is pivotal for EDA, as it helps in recognizing underlying structures, trends, and outliers that might not be apparent from the raw data alone. Python offers a wealth of libraries for data visualization, including:
- Plotly Express: A high-level interface for interactive graphing.
- Matplotlib: A widely used library for creating static, animated, and interactive visualizations.
- Seaborn: A library based on matplotlib that provides a high-level interface for drawing attractive statistical graphics.
For instance, Plotly Express's scatter_matrix can be utilized to explore relationships between multiple variables:
import plotly.express as px
df = pd.read_csv('your_dataset.csv')
px.scatter_matrix(
    df, dimensions=["feature1", "feature2", "feature3"], color="target_variable",
    height=800, title="Scatter Matrix of Features"
)

This method enables the rapid exploration of pairwise relationships within a dataset, facilitating the identification of patterns, correlations, and potential hypotheses for deeper analysis.
Is there a way to automate EDA?
There are libraries designed to automate the EDA process, significantly reducing the time and effort required to understand a dataset. One such library is ydata-profiling, which generates comprehensive reports from a pandas DataFrame, providing insights into the distribution of each variable, correlations, missing values, and much more.
Example with ydata-profiling:
from ydata_profiling import ProfileReport
df = pd.read_csv('your_dataset.csv')
profile = ProfileReport(df, title='Pandas Profiling Report', minimal=True)
profile.to_widgets()
While automated EDA tools like ydata-profiling can offer a quick and broad overview of the dataset, they are not a complete substitute for manual EDA. Human intuition and expertise are crucial for asking the right questions, interpreting the results, and making informed decisions on how to proceed with the analysis. Therefore, automated EDA should be viewed as a complement to, rather than a replacement for, traditional exploratory data analysis methods.
How can you handle missing values in datasets?
Handling missing values in datasets is crucial for maintaining data integrity. Here are common methods:
- Remove Data: Delete rows with missing values, especially if the missing data is minimal.
- Impute Values: Replace missing values with a statistical substitute like mean, median, or mode, or use predictive modeling.
- Indicator Variables: Create new columns to indicate data is missing, which can be useful for some models.
MissingNo is a tool for visualizing missing data in Python. To use it:
- Install MissingNo:
pip install missingno - Import and Use:
import missingno as msno
import pandas as pd

data = pd.read_csv('your_data.csv')
msno.matrix(data)  # Visual matrix of missing data
msno.bar(data)     # Bar chart of non-missing values
These visualizations help identify patterns and distributions of missing data, aiding in effective preprocessing decisions.