4.3. Logging
What is Software Logging?
Logging is the practice of recording events, messages, and errors that occur during an application's execution. It's a fundamental aspect of software engineering that provides a detailed, real-time narrative of how a system is operating. This record is indispensable for debugging, monitoring, and auditing.
Every application communicates through two primary channels:
- Standard Output (stdout): Used for displaying standard informational messages and results. In Python, this is
sys.stdout. - Standard Error (stderr): Reserved for error messages and diagnostics. Separating errors from standard output allows for cleaner, more focused monitoring and debugging. In Python, this is
sys.stderr.
To bring order to log messages, developers use logging levels to categorize them by severity:
DEBUG: Granular information, useful only for in-depth debugging.INFO: Confirmation that the application is behaving as expected.WARNING: Indicates an unexpected event or a potential future problem (e.g., "low disk space"). The application continues to function correctly.ERROR: A serious issue has prevented a specific function from completing.CRITICAL: A severe error that may terminate the program's execution.
Why is Logging Crucial in MLOps?
In MLOps, logging transcends simple debugging; it's a cornerstone of operational excellence. Models and data pipelines can fail in numerous ways, from data drift and unexpected input schemas to infrastructure issues. Effective logging is vital for:
- Debugging and Troubleshooting: Quickly pinpointing the root cause of failures in training jobs, data processing pipelines, or model inference services.
- Monitoring: Observing the health and performance of ML systems in production. Are inference times increasing? Is the model encountering a high rate of unseen data categories?
- Audit Trails and Compliance: Creating an immutable record of every significant event, such as model training runs, deployments, and prediction requests. This is often a requirement for regulatory compliance.
- Performance Analysis: Logging key metrics (e.g., prediction latency, data batch processing time) helps identify performance bottlenecks.
Without detailed logs, diagnosing a problem in a complex, multi-stage ML pipeline becomes a near-impossible task, leading to extended downtime and unreliable systems.
What is the Best Logging Tool for Python?
While Python's built-in logging module is powerful, its configuration can be verbose and complex. For a modern, streamlined approach, loguru is the recommended choice. It offers a simpler, more intuitive API with powerful features out-of-the-box, such as effortless file logging, rotation, and structured logging.
Here is an example of how loguru can be used to instrument an inference job, providing clear visibility into each step of the process:
from loguru import logger

# Example of logging within an inference job
def run(self):
    # Log the initial state and services being used
    logger.info("Starting inference job...")
    logger.debug("Logger Service: {}", self.logger_service)

    # Log the input reading step
    logger.info("Reading inputs from: {}", self.inputs)
    inputs_ = self.inputs.read()
    inputs = schemas.InputsSchema.check(inputs_) # Validate inputs
    logger.debug("Input data shape: {}", inputs.shape)

    # Log model loading details
    logger.info("Loading model from registry: {}", self.mlflow_service.registry_name)
    model_uri = registries.uri_for_model_alias_or_version(
        name=self.mlflow_service.registry_name,
        alias_or_version=self.alias_or_version,
    )
    logger.debug("Resolved Model URI: {}", model_uri)
    model = self.loader.load(uri=model_uri)
    logger.debug("Model object loaded: {}", model)

    # Log the prediction step
    logger.info("Generating predictions for {} inputs.", len(inputs))
    outputs = model.predict(inputs=inputs)
    logger.debug("Output data shape: {}", outputs.shape)

    # Log the output writing step
    logger.info("Writing outputs to: {}", self.outputs)
    self.outputs.write(data=outputs)

    # Log the final notification
    logger.info("Inference job finished successfully.")
    self.alerts_service.notify(
        title="Inference Job Finished", message=f"Outputs Shape: {outputs.shape}"
    )
    return locals()
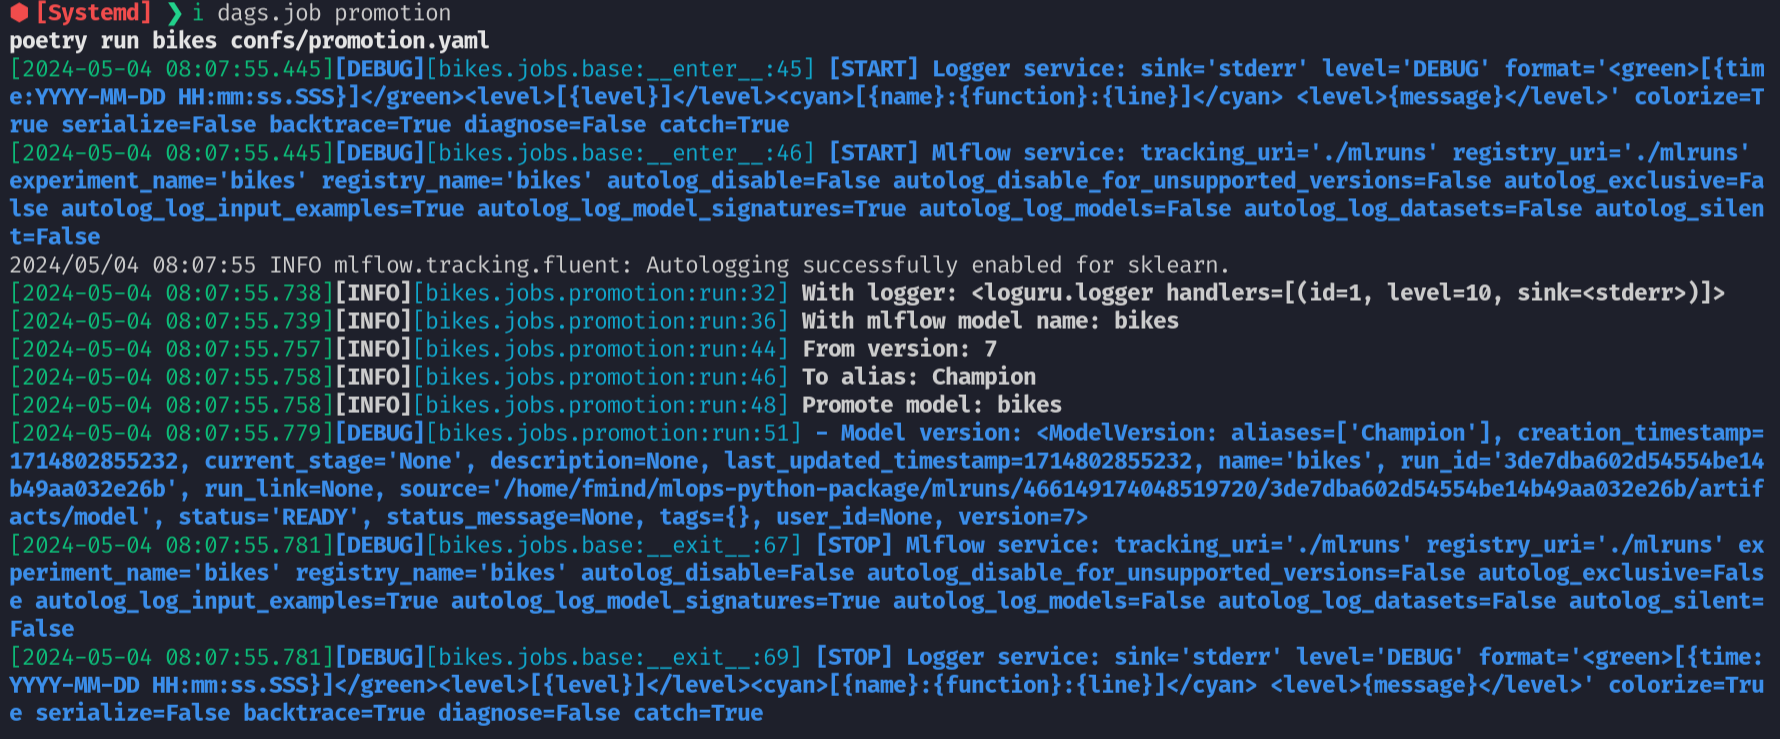
This example shows how loguru makes it easy to add meaningful, context-rich log messages at every stage, which are sent to stderr by default.
How Can You Configure Loguru for a Project?
loguru can be configured centrally to ensure consistent logging behavior across your entire application. A common pattern is to create a dedicated LoggerService that initializes the logger with project-specific settings.
This approach allows you to manage your logging configuration (like sinks, levels, and formats) in one place, often driven by environment variables or a configuration file.
import pydantic as pdt

class LoggerService(Service):
    """Service for logging messages.

    https://loguru.readthedocs.io/en/stable/api/logger.html

    Parameters:
        sink (str): logging output.
        level (str): logging level.
        format (str): logging format.
        colorize (bool): colorize output.
        serialize (bool): convert to JSON.
        backtrace (bool): enable exception trace.
        diagnose (bool): enable variable display.
        catch (bool): catch errors during log handling.
    """

    sink: str = "stderr"
    level: str = "DEBUG"
    format: str = (
        "<green>[{time:YYYY-MM-DD HH:mm:ss.SSS}]</green>"
        "<level>[{level}]</level>"
        "<cyan>[{name}:{function}:{line}]</cyan>"
        " <level>{message}</level>"
    )
    colorize: bool = True
    serialize: bool = False
    backtrace: bool = True
    diagnose: bool = False
    catch: bool = True

    @T.override
    def start(self) -> None:
        loguru.logger.remove()
        config = self.model_dump()
        # use standard sinks or keep the original
        sinks = {"stderr": sys.stderr, "stdout": sys.stdout}
        config["sink"] = sinks.get(config["sink"], config["sink"])
        loguru.logger.add(**config)

    def logger(self) -> loguru.Logger:
        """Return the main logger.

        Returns:
            loguru.Logger: the main logger.
        """
        return loguru.logger
What is Structured Logging and Why is it Essential?
Structured logging is the practice of recording logs in a consistent, machine-readable format, such as JSON, instead of plain text. Each log entry is a data object with key-value pairs.
Why is it essential?
- Querying and Analysis: Tools like Elasticsearch, Splunk, or Datadog can easily ingest, index, and search structured logs. You can run complex queries like: SELECT * WHERE level='ERROR' AND module='payment_processing'.
- Automation: Automated alerting systems can parse structured logs to trigger alerts based on specific error codes, performance metrics, or event types.
- Contextualization: It's easy to add rich, nested context to a log entry (e.g., user ID, request trace, model version) without creating a messy, unreadable text message.
For MLOps, this means you can create powerful dashboards and alerts that monitor model health, data quality, and pipeline status by querying your log data directly.
What are Best Practices for Logging?
- Use the Right Log Level: Don't log everything as
INFO. UseDEBUGfor verbose development output,INFOfor key operational events,WARNINGfor non-critical issues, andERRORfor failures. - Provide Rich Context: A log message like "An error occurred" is useless. Include relevant data: "Failed to process batch ID
12345for modelxgboost-v2.1due to missing featureuser_age." - Log in a Structured Format (JSON): As discussed, this makes your logs machine-readable and vastly more powerful for monitoring and analysis. Use
loguru'sserialize=Trueoption. - Do Not Log Sensitive Data: Never log personally identifiable information (PII), passwords, API keys, or other secrets. Sanitize your logs to protect privacy and security.
- Centralize Your Logs: In a distributed system (like microservices or Kubernetes), send logs from all services to a central logging platform (e.g., ELK Stack, Grafana Loki, Datadog). This gives you a unified view of your entire system.
- Configure Sinks per Environment: Log to
stderrin development for easy viewing. In production, log to a file and/or a centralized logging service. - Implement Log Rotation: To prevent log files from consuming excessive disk space, configure log rotation to automatically archive or delete old files based on size or age.
loguruhandles this automatically when logging to a file. - Correlate Logs with Traces: In complex systems, use a correlation ID (or trace ID) to link all log messages generated from a single request or transaction as it flows through different services.